Discovery & design Phase
Children’s Miracle Network Hospitals® raises funds and awareness for 170 member hospitals that provide 32 million treatments each year to kids across the U.S. and Canada. Donations stay local to fund critical treatments and healthcare services, pediatric medical equipment, and charitable care. Since 1983, Children’s Miracle Network Hospitals has raised more than $5 billion, most of it $1 at a time through the charity's Miracle Balloon icon. Its various fundraising partners and programs support the nonprofit's mission to save and improve the lives of as many children as possible.
My team consisted of CMNH VP Project Management, Account Manager, Project Manager, backend IT Developer, and myself (Senior User Experience Designer / Product Designer).
The Discovery phase included a kick-off meeting with all relevant stakeholders to understand the scope, objectives, timing, and budget of updating the Easy Partner Manage Reporting (EZPMR) portal within their Mission Control system. Some essential goals of this project included: making EZPMR more user-friendly as well as offering additional features to select users. This portal helped users report quarterly donations, track campaign data, and predict future campaign efforts.
My work quickly began with performing user interviews with hospital associates, program directors, and market directors to evaluate concerns, friction points, and usability processes within the current system.
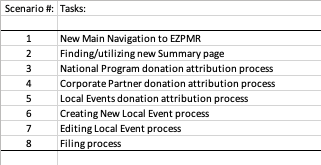
Analyzing this information helped me create accurate user stories, identify up to 8 future user testing scenarios, and measure moderated Time to Task sessions — which would, in turn, reveal where I could reduce hierarchical process steps, and make EZPMR more intuitive and easy to use.
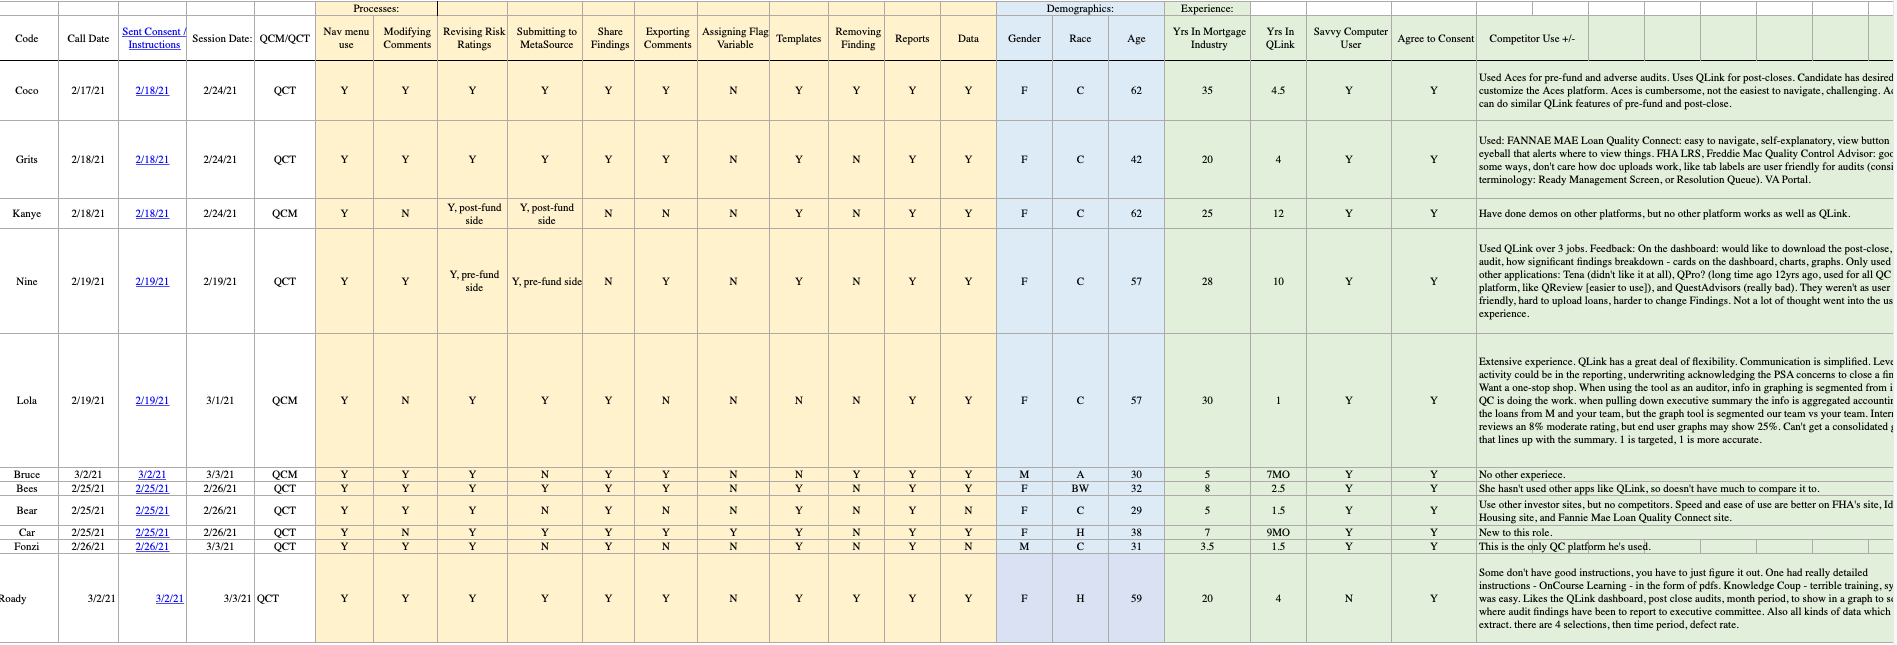
About a dozen qualified users were screened and selected to participate in moderated user testing sessions. This spreadsheet documented user's roles, processes, demographics, and levels of experience using EZPMR.
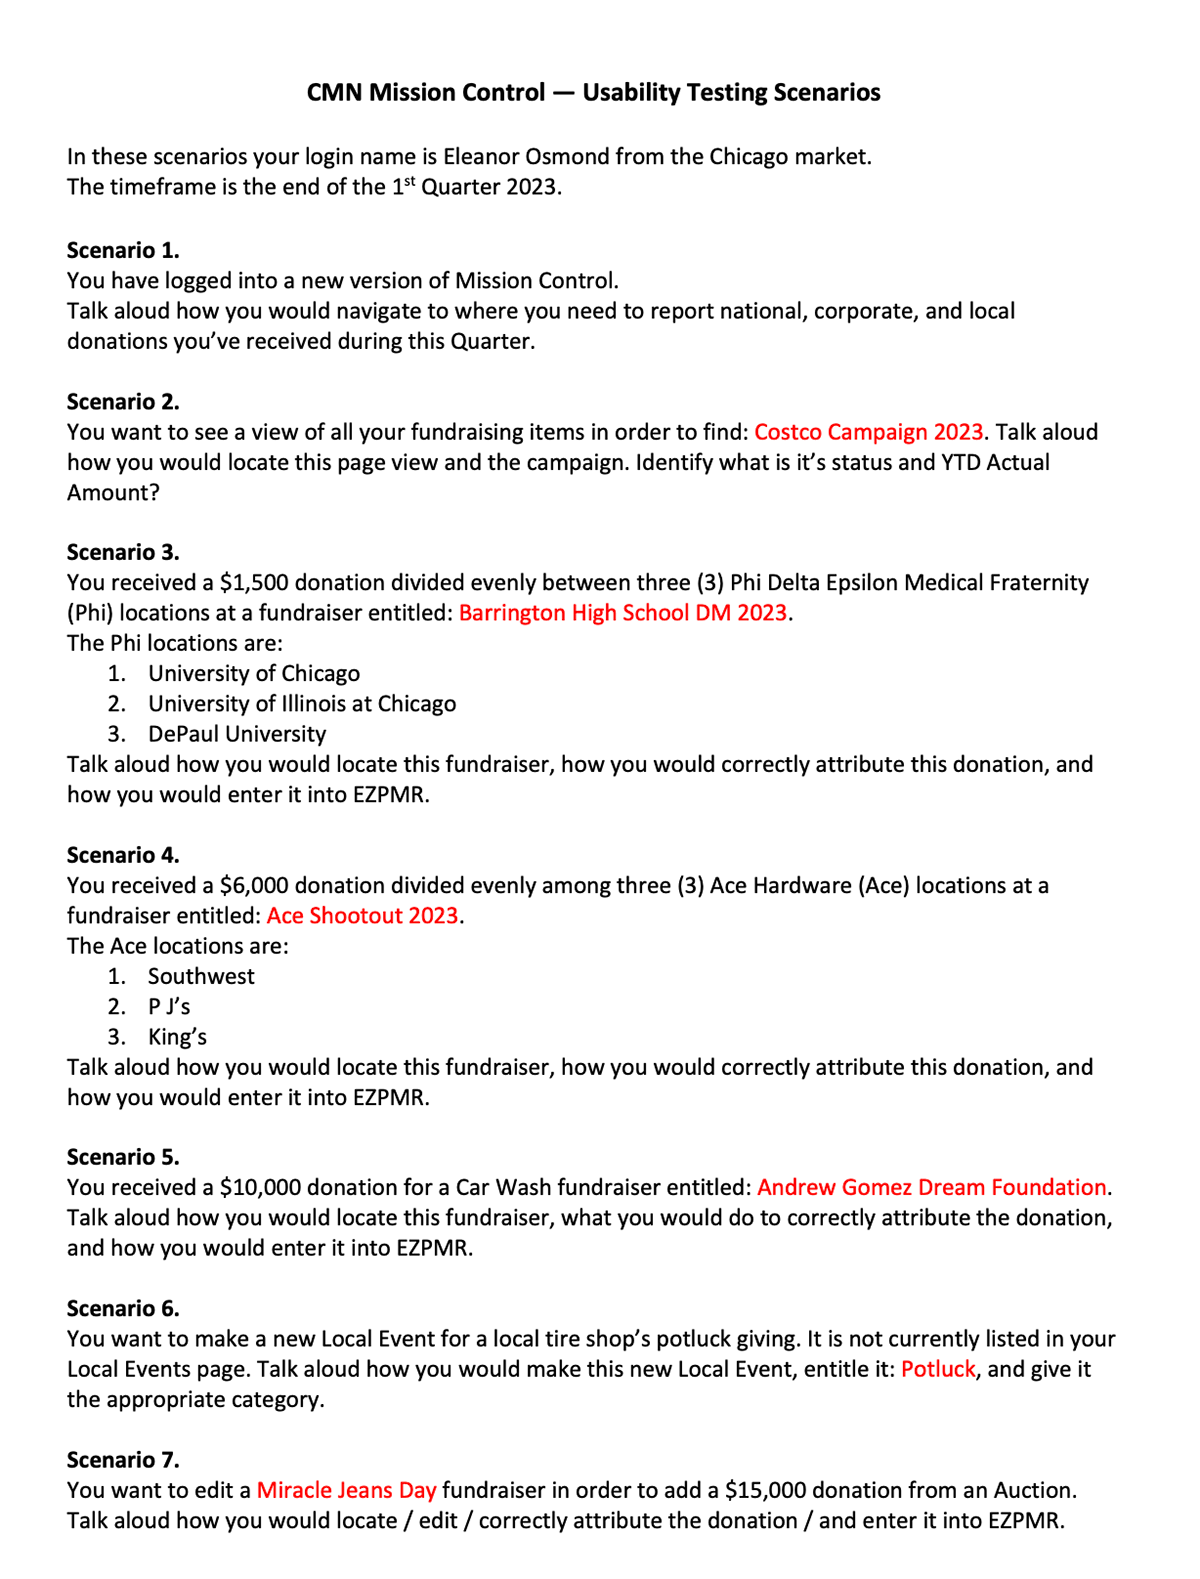
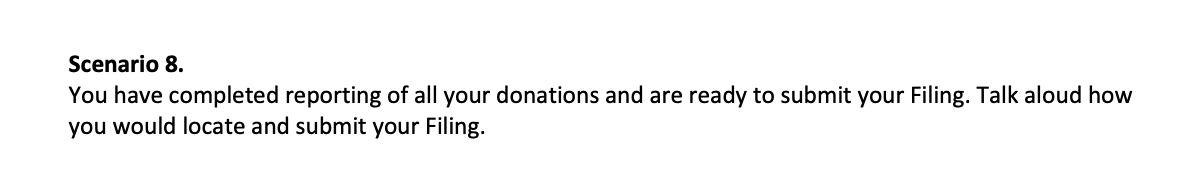
These 8 Scenarios were carefully crafted to capture every process we needed to analyze within EZPMR in order to make informed and optimized design decisions later on.
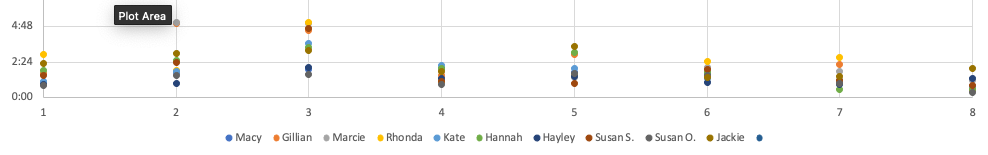
Time to Task analysis revealed specific friction points which users experienced while performing certain essential process tasks, seen in the longer task times. These could be opportunities for optimization.
visual hierarchical task analysis
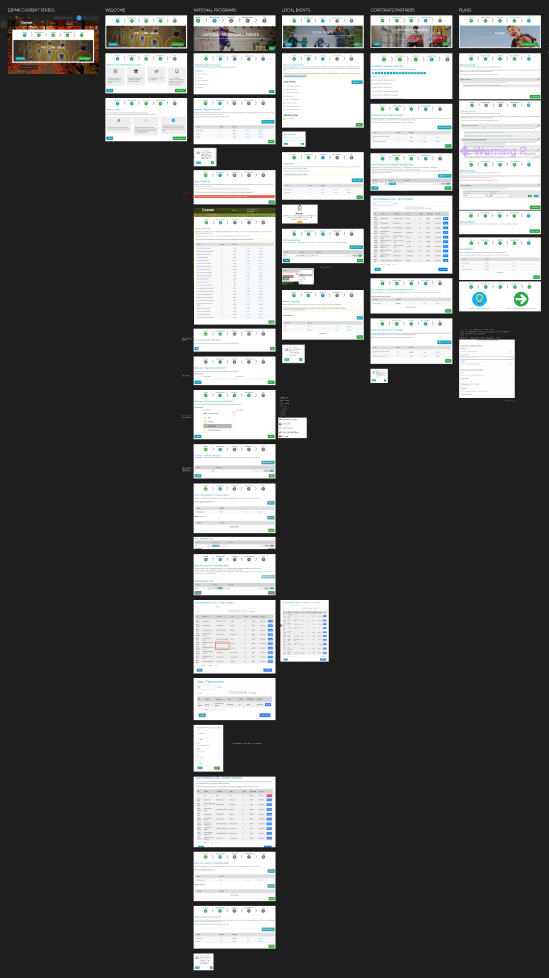
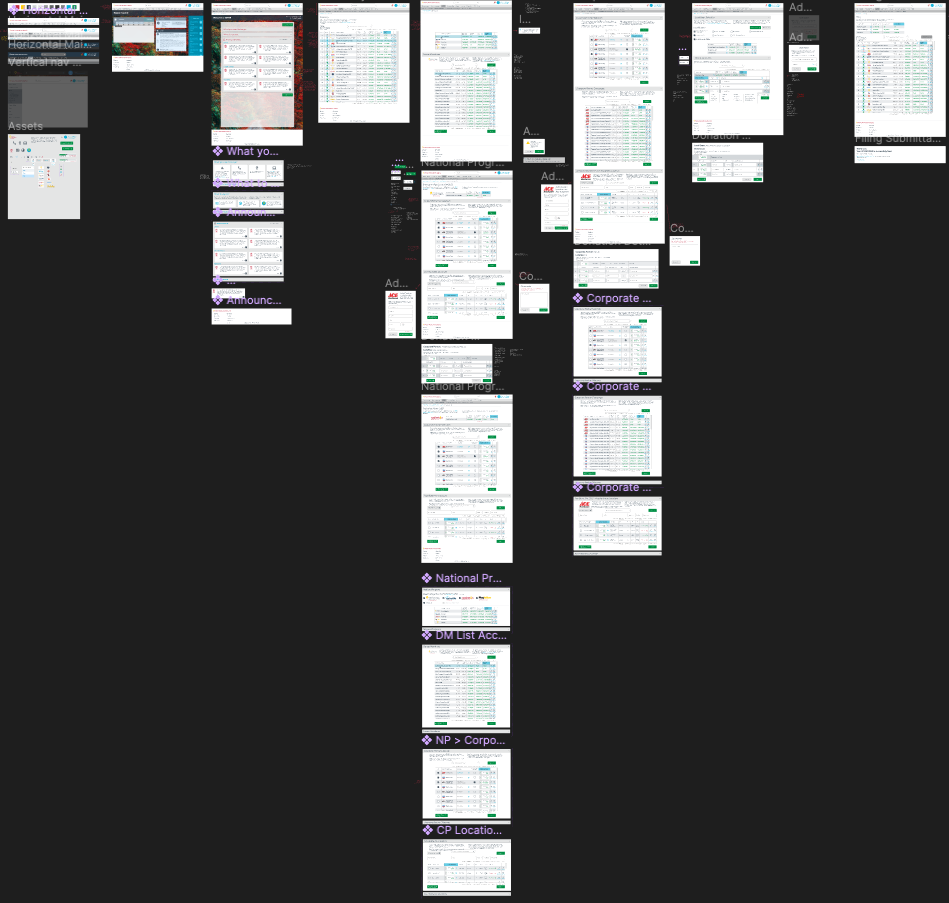
A visual capture of every process step in which users had to engage helped clearly see where optimization opportunities and unnecessary redundancies could be redesigned. This flowed from the Sign On dashboard, to the Welcome page, National Programs, Local Events, Corporate Partners, and finally the Filing steps. All taken into account:
This analysis showed the amount of optimization achieved by specifically reducing the number of process steps to complete certain tasks:
1. Reporting Donations to National Programs: 22% reduction (from 18 to 14 steps)
2. Reporting Donations to Corporate Partner Campaigns: 22% reduction (from 14 to 11 steps)
3. Reporting Donations to Local Events: 38% reduction (from 13 to 8 steps)
Ux/ui wireframing
The Discovery phase provided the team a clear direction on design requirements.
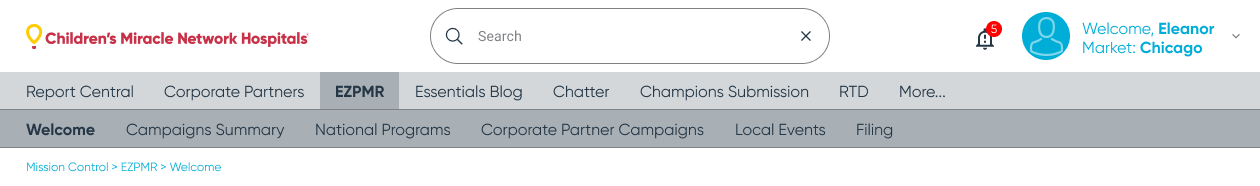
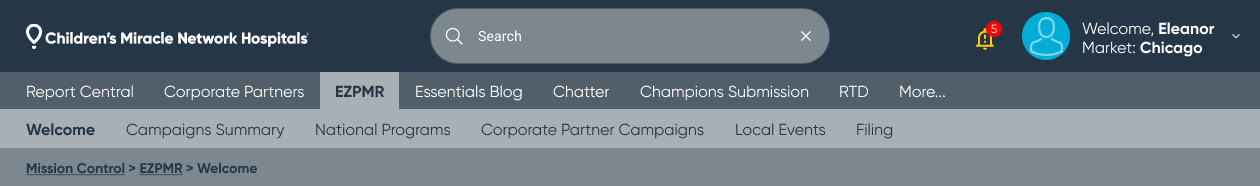
Next phase: the platform required a new approach to the main header bar: main / secondary / tertiary navigation, search, account settings, and breadcrumbs with Light and Dark Themes:
Since this was an existing platform and we knew the specific data informing our future optimizations, we moved directly to high-fidelity wireframes in Figma. Daily and weekly team discussions helped us iterate further considerations as we went along.
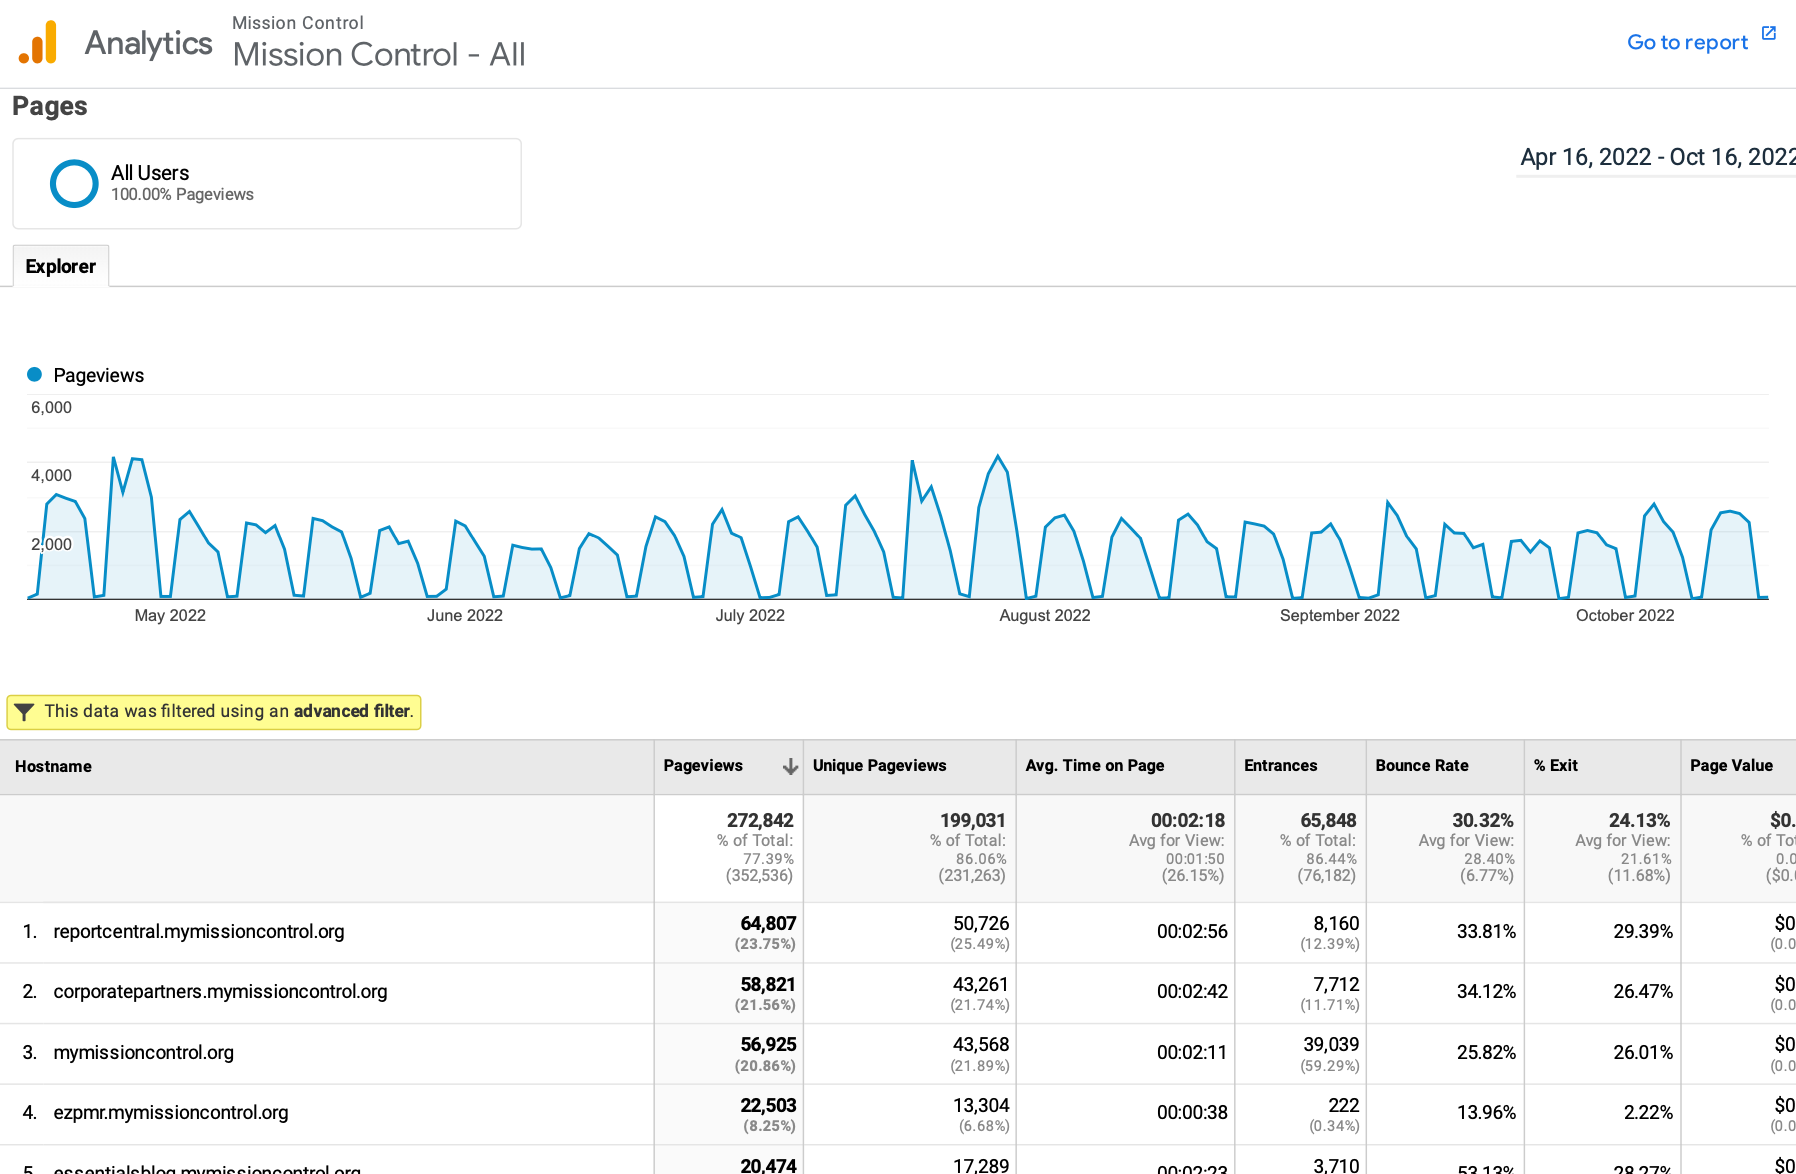
Further analytics analysis showed important page view data which helped us audit and prioritize main navigation items to access most easily:
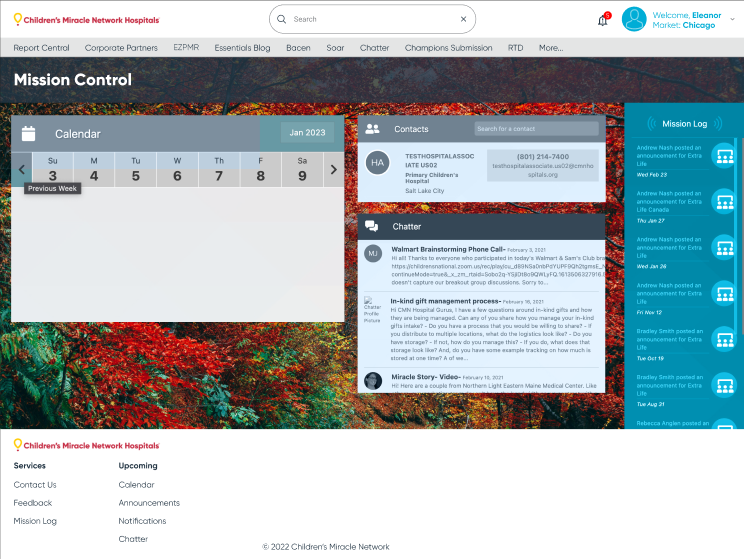
This new Mission Control dashboard design incorporated a number of important upgrades in the UI and user experience:
• Prominent Search enabled users to see specific reporting details like upcoming Corporate Partner campaigns.
• Notifications icon in the site-wide courtesy navigation helped users see and easily get to important information regarding updates, news, etc.
• Account information confirmed the logged-in user as well as the Market that user represented.
• Other essential modules in the dashboard brought relevant information front and center before users navigated to other pages.
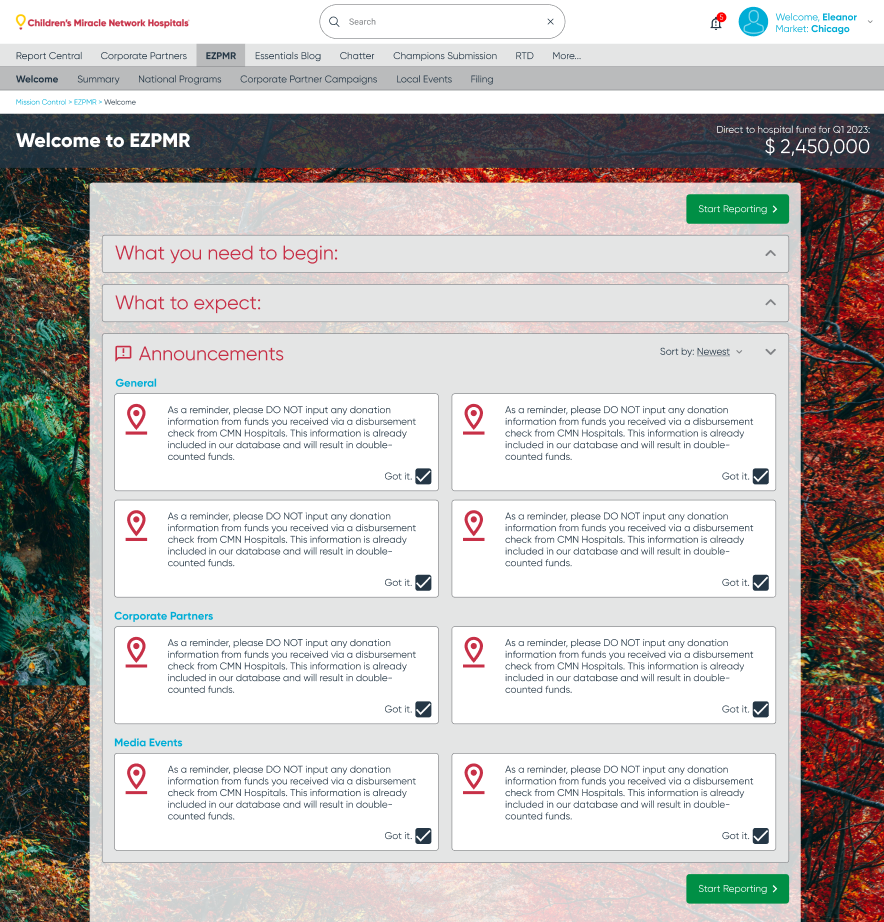
Welcome to EZPMR page:
• Donation Reporting within the EZPMR platform displayed the prior Quarter fundraising amount.
• Prominent "Start Reporting" call-to-action buttons guided users directly into the reporting process.
• Since many users used this platform on a quarterly basis it was necessary to include easy-to-get-to instructional bars to remind and guide users on the reporting steps.
• Vital Announcements included a validation checkbox to confirm users had engaged with the announcement.
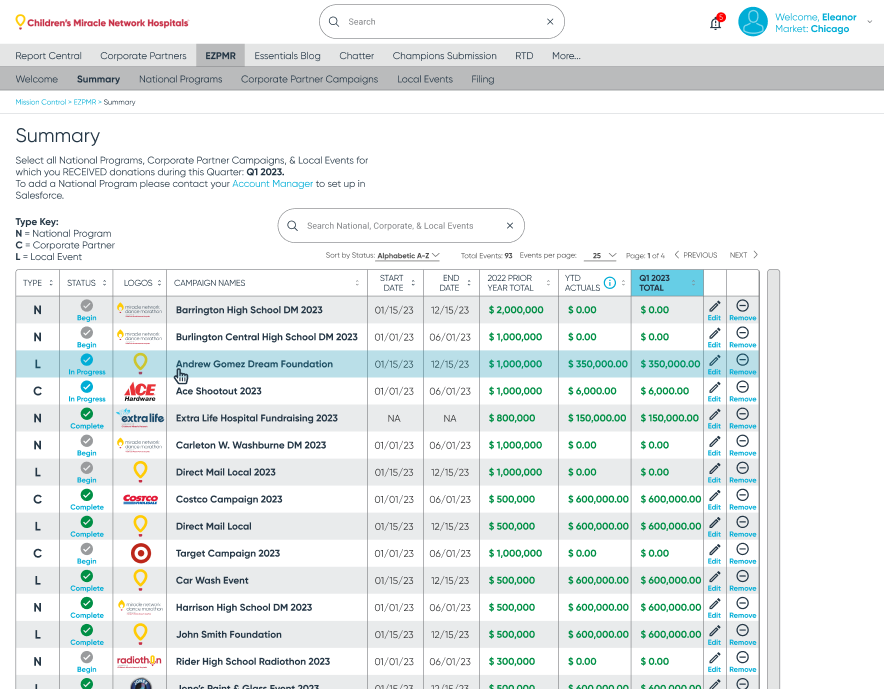
Summary Page:
This page quickly displayed key high-level reporting information and enabled users to both search within all their campaigns, Sort by Status, and navigate quickly to more detail as needed.
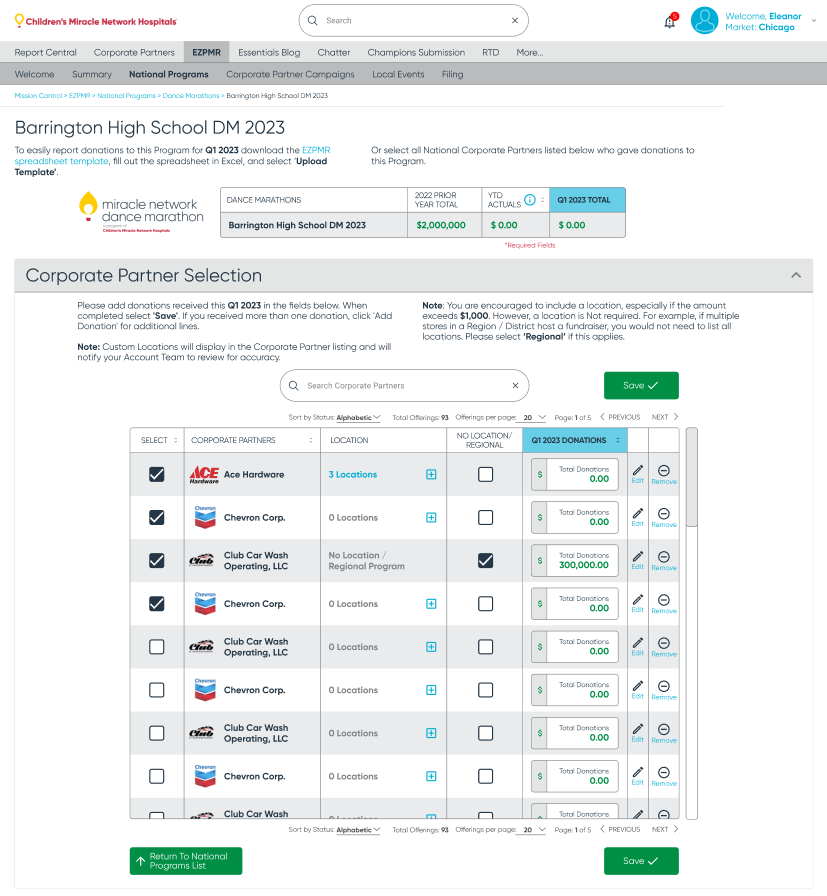
National Programs:
This section of EZPMR was the most complex because it involved a number of process dependencies that the UI had to capture in sequence.
1. Users had to select the over-arching campaign.
2. Followed by the specific program within that campaign (i.e. Barrington High School DM 2023).
3. Followed by the Corporate Partners Selection associated with the program (i.e. Ace Hardware) in a collapsible section.
4. Choose the specific Local or Regional Corporate Partner locations for that program and the donation amounts.
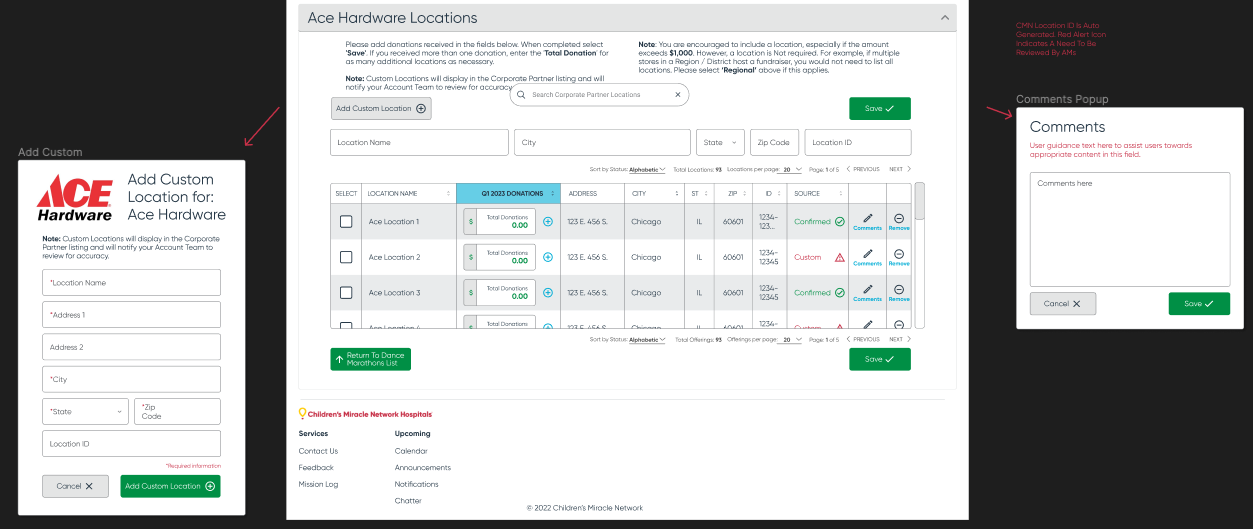
5. Be able to add custom locations to a "Confirmed" Corporate Partners' list as they continued to expand and update.
6. Add a comments section. This was a controversial UI element that users demanded, yet the team had reticence in adding for the simple fact that the contents of comment sections is not measurable or quantifiable so information could get challenged to relocate later on.
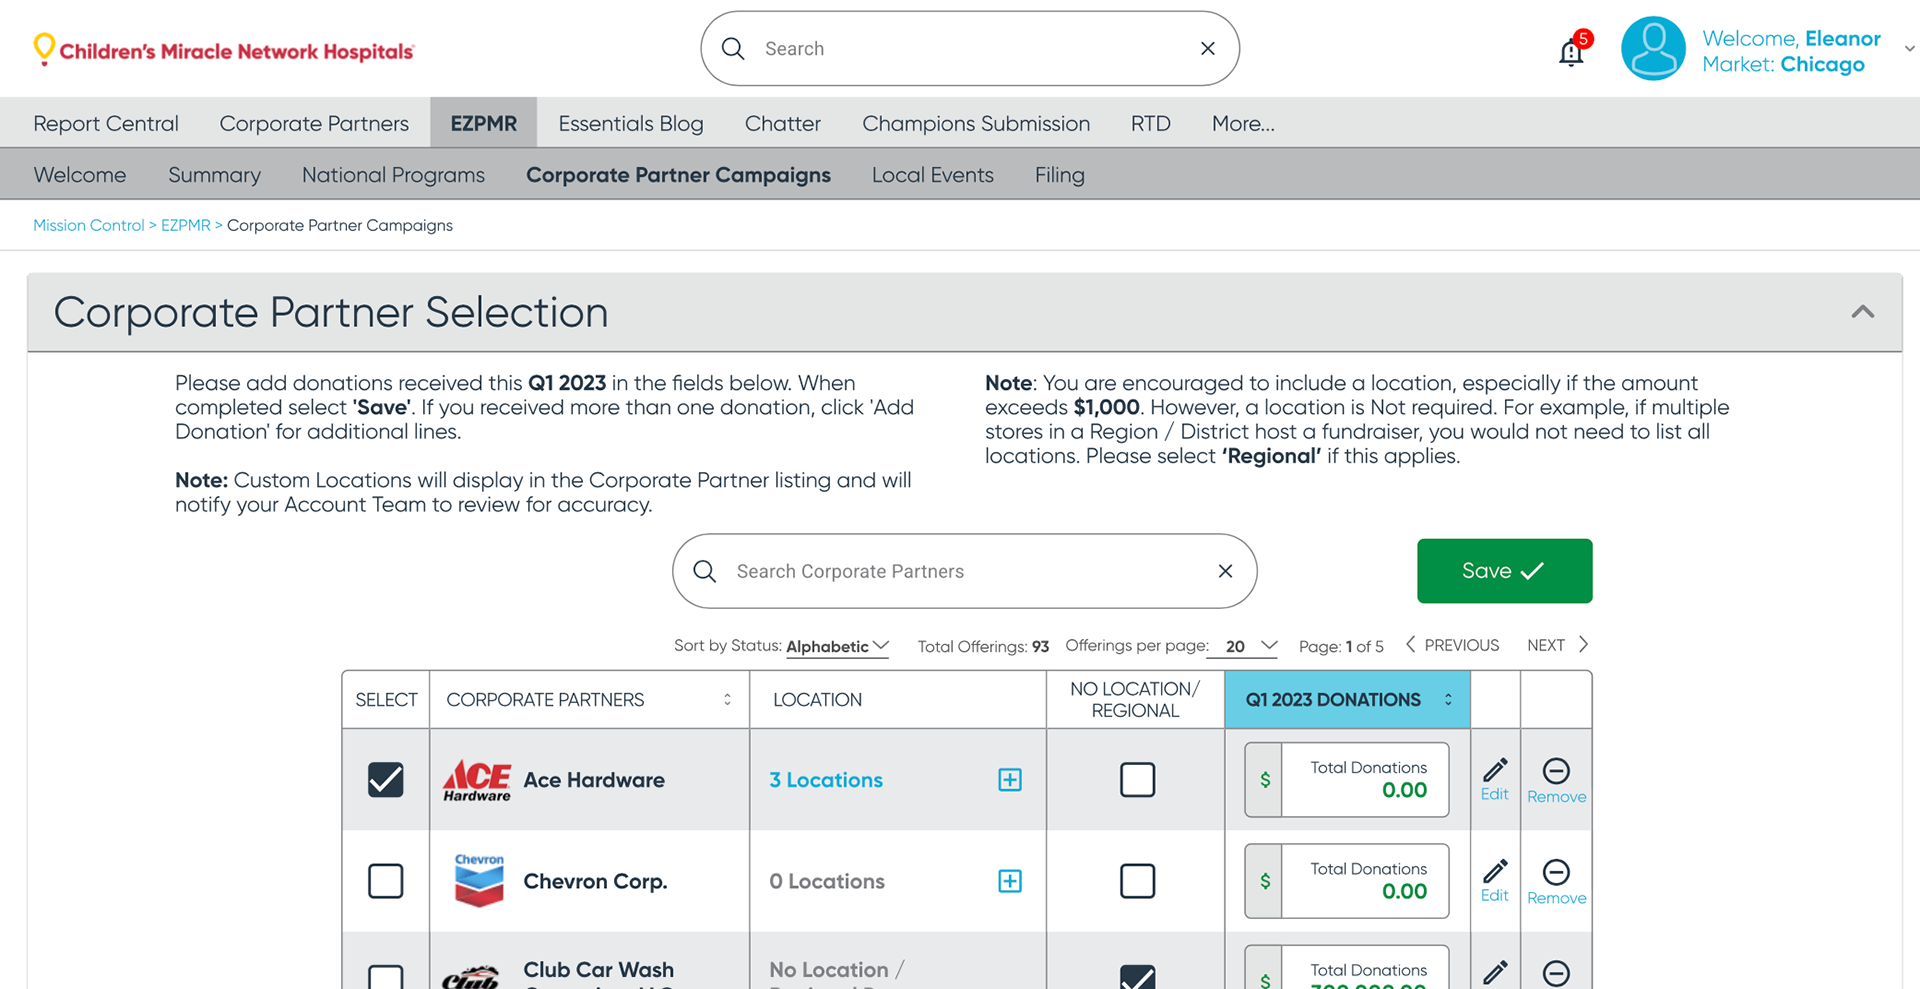
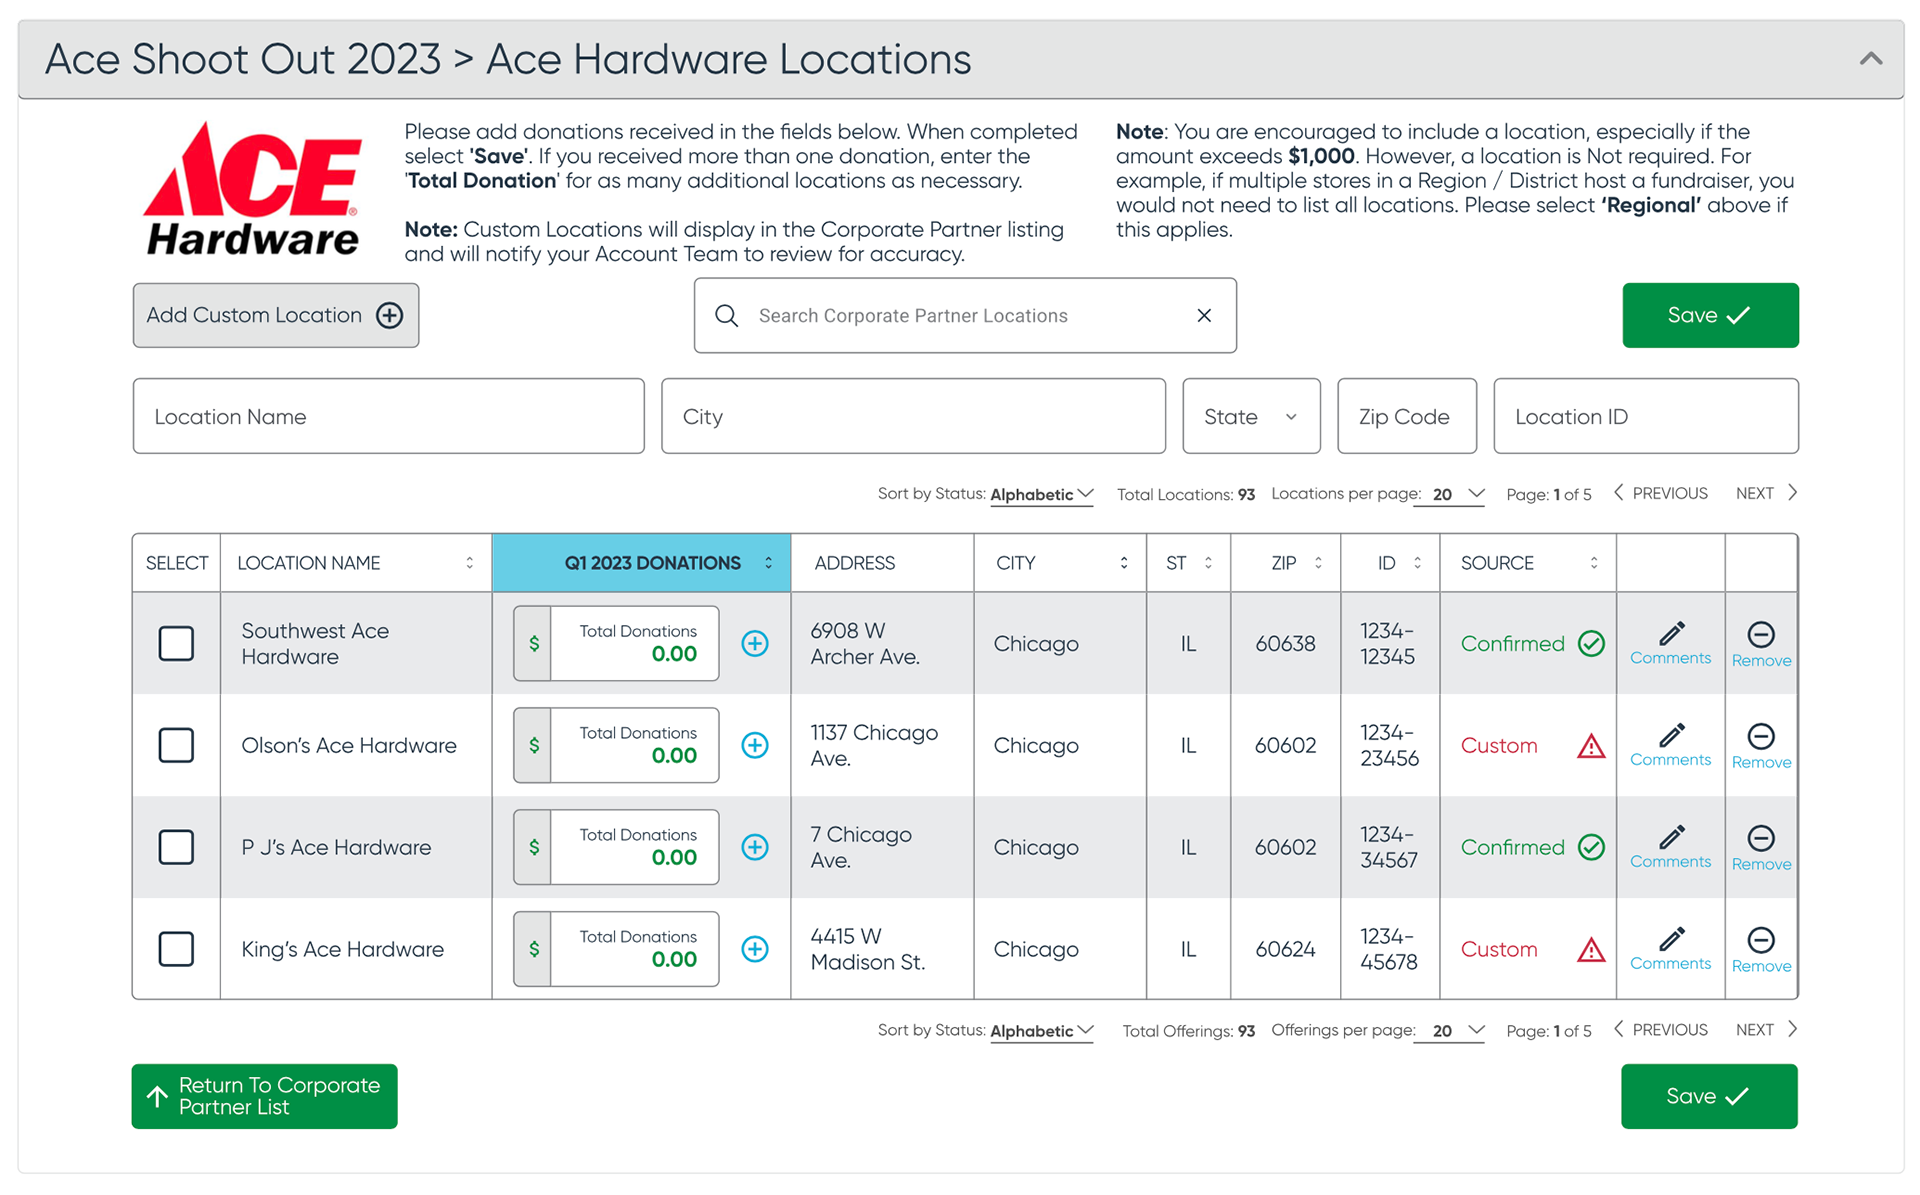
Corporate Partner Campaigns:
This section had to follow certain steps as well. Starting with selecting the partner for which the user was reporting donation information.
In this example, Ace Hardware is selected and users could select the specific locations participating in that particular campaign:
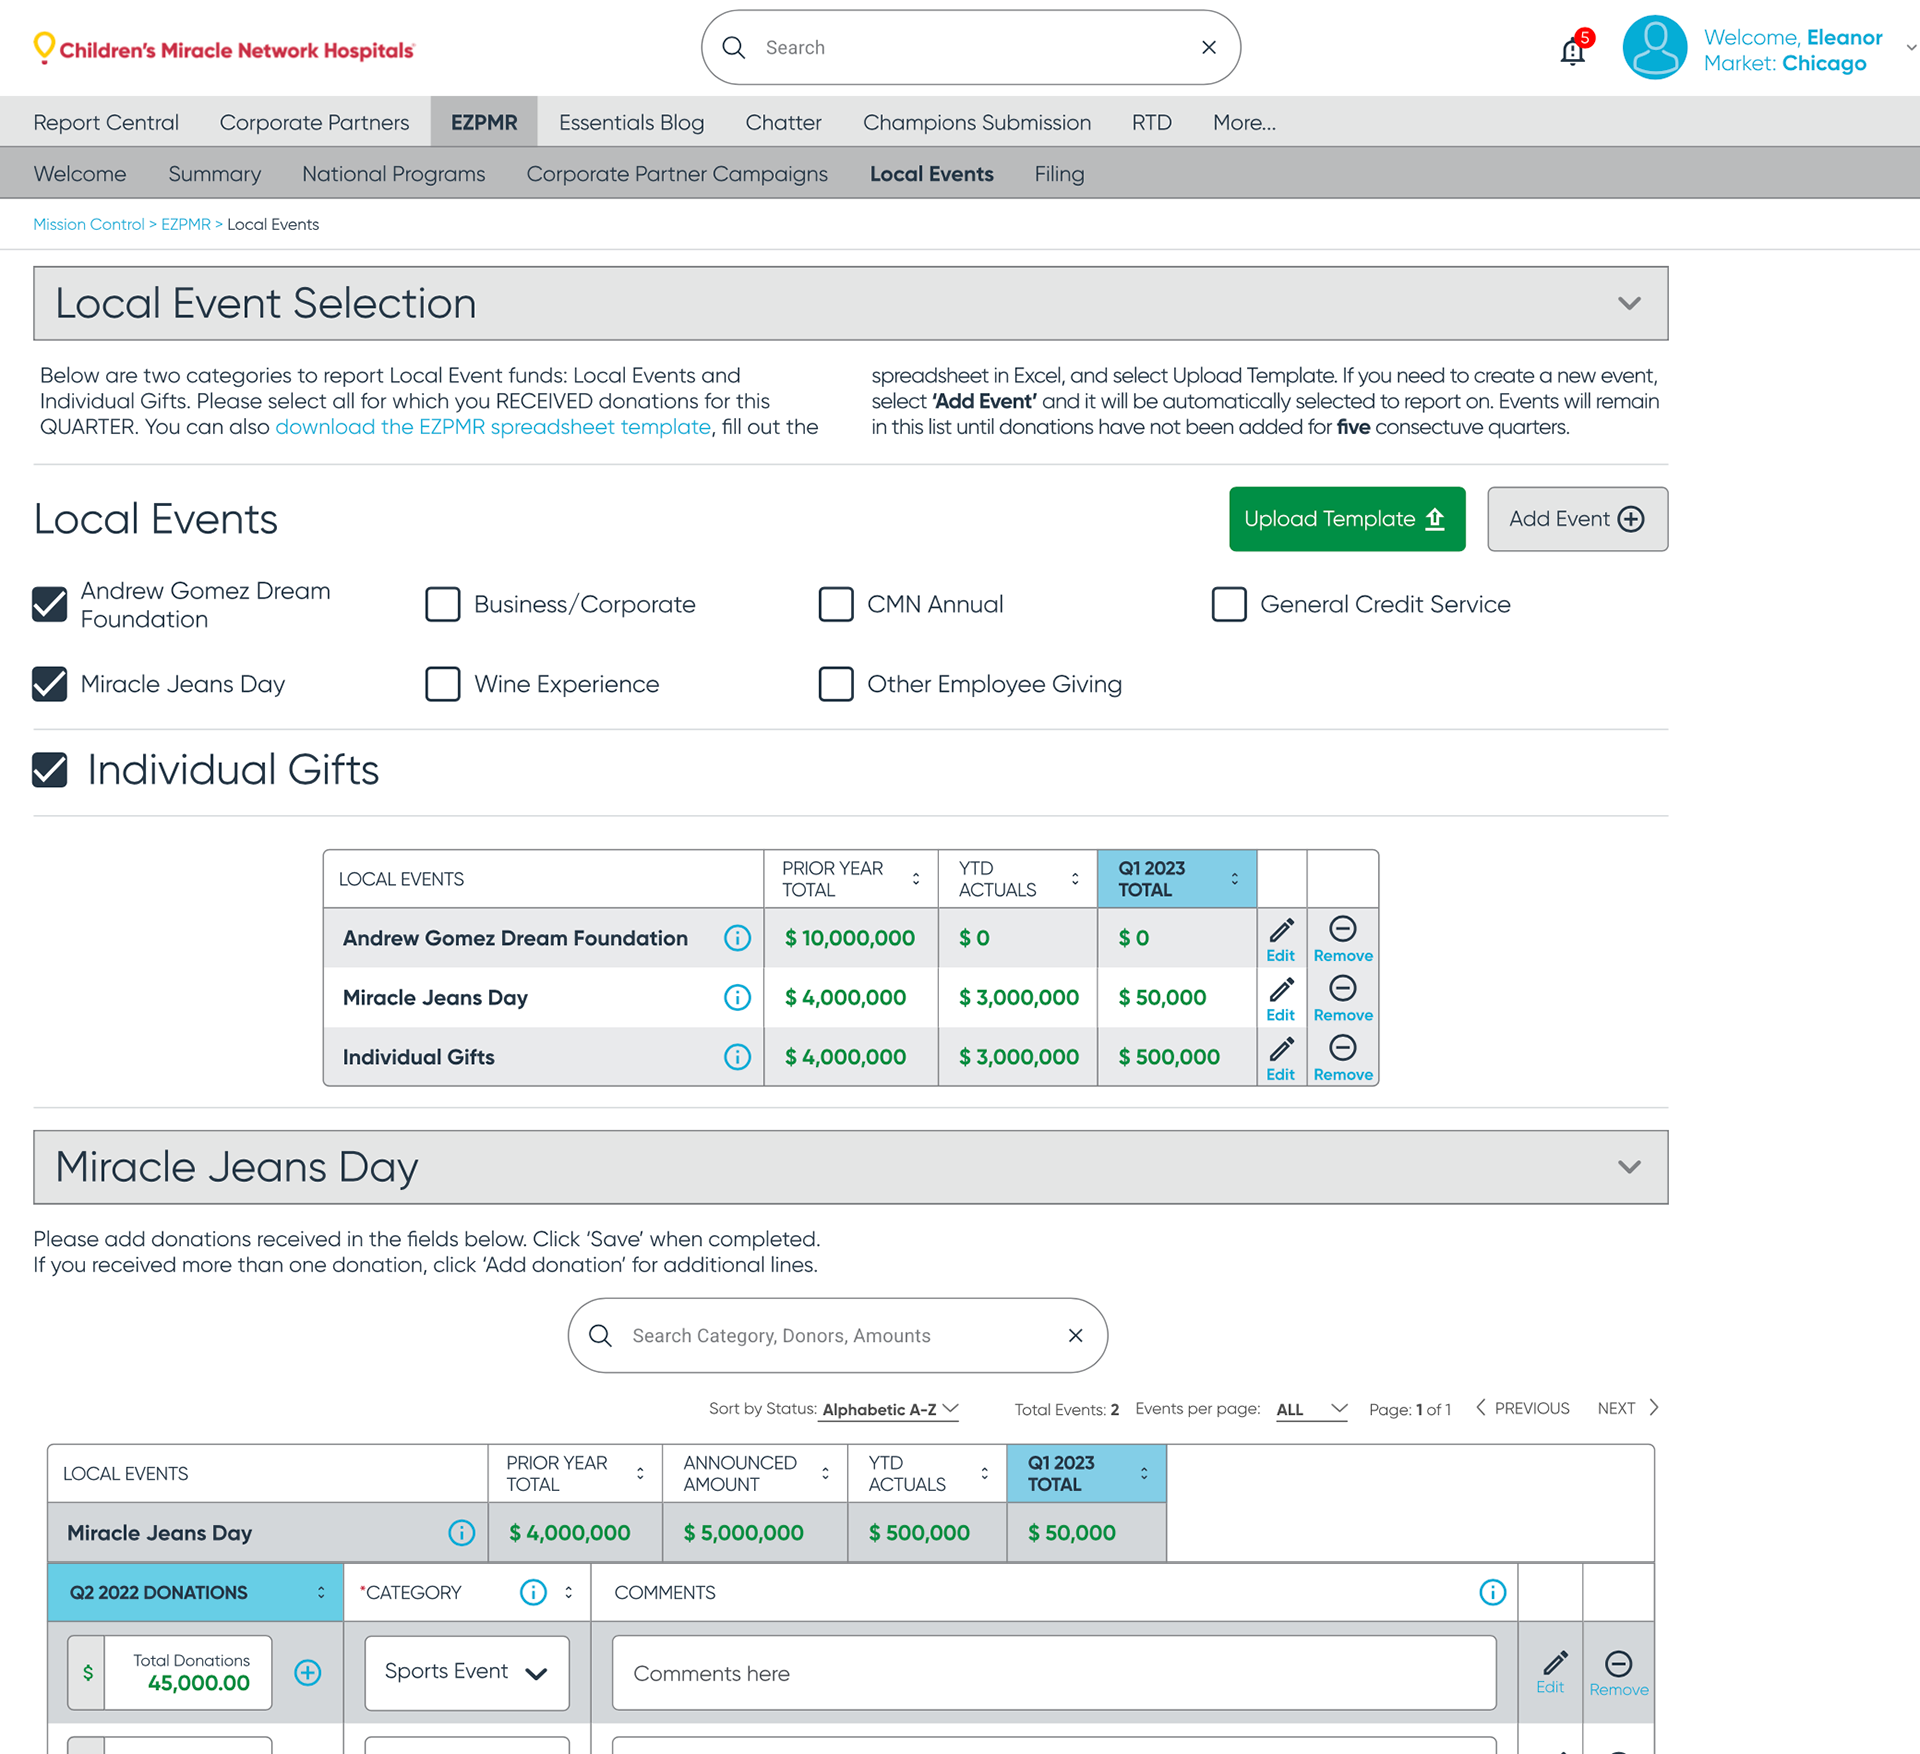
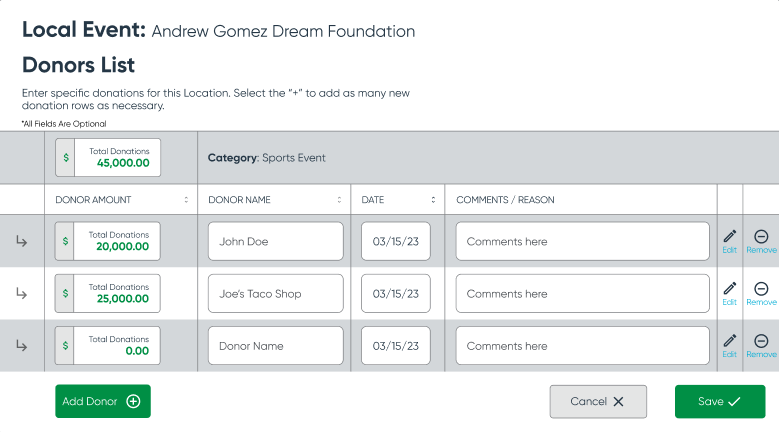
Local Events:
This section helped users select all the local events, including Individual Gifts, to track donations. This also had to enable users to capture and identify individual donors, dates, and amounts:
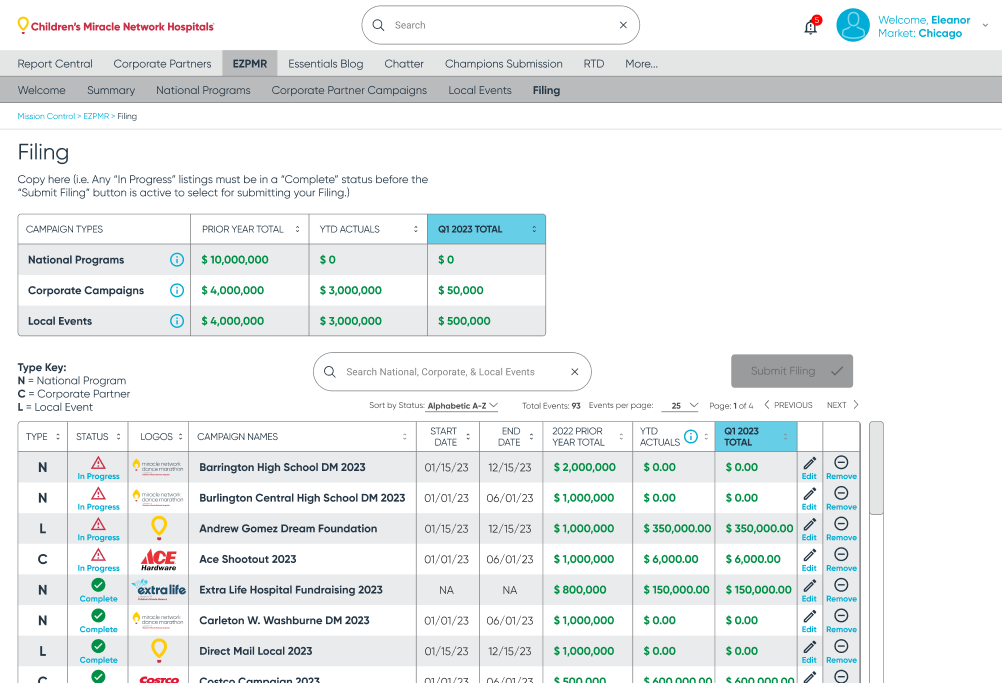
Filing:
Finally users reached the Filing step which displayed the latest reporting information the user's had entered during their session.
This section visually guided users to "Status" areas of their reporting that still required attention and prevented them from selecting the "Submit" button until those "Alerted" areas were reconciled. This UI approach significantly reduced user errors and the need for future underwriting oversight:
final thoughts
Overall, this project was extremely successful in meeting the needs of shareholders and users alike.
To find out why children's hospitals need community support, identify your member hospital and learn how you can Put Your Money Where the Miracles Are, please visit Children's Miracle Network Hospitals.