
Discovery & design Phase
For the last sixteen+ (16) years Orchard has amassed a notable reputation managing various commercial real estate developments ranging from $20 million to $200+ million. They kept control of all these moving parts manually through a well-oiled operations team. The VP of Operations, specifically, had an incredible amount of tribal knowledge we had to capture in order to ensure their processes continued to run more smoothly than ever.
My team consisted of Account Manager, Project Manager, Business Analyst, and myself (Senior User Experience Designer / Product Designer). I used to own and operate a bridge lending company, so I was very familiar with the investment industry, its unique vocabulary, acronyms, and regulatory requirements. This background aided me and my team getting up to speed quickly.
Through a number of online and onsite meetings with Orchard's internal teams we began visualizing the process flow of user interactions. This included understanding all the user groups that would need specific permission rights, viewing access, and editing allowances. Although all of their processes from A to Z were important to capture and understand, the MVP (Minimum Viable Product) specifically isolated Operation's processes (user diagram flow shown below):
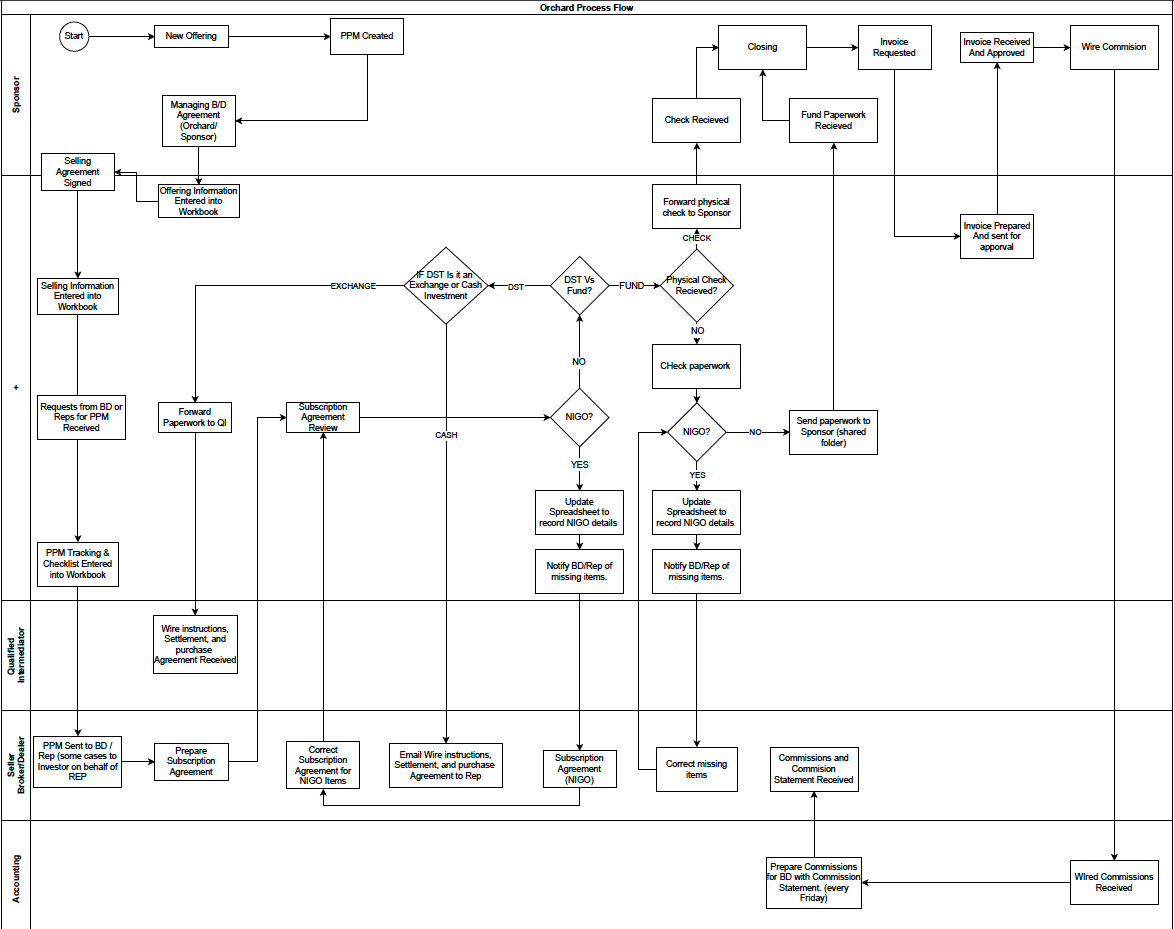
Note: Due to current confidentiality requirements, I'm permitted to share overall processes and results without disclosing proprietary details which are still under development and testing.
user stories
A number of business analysis tools were utilized to keep track of essential details. No one on the team could afford to have regulatory requirements and other user privacy, tracking, and permission elements of the process fall through the cracks. Below are a few of the mechanisms we employed to make sure all aspects of the user journeys were accounted for.
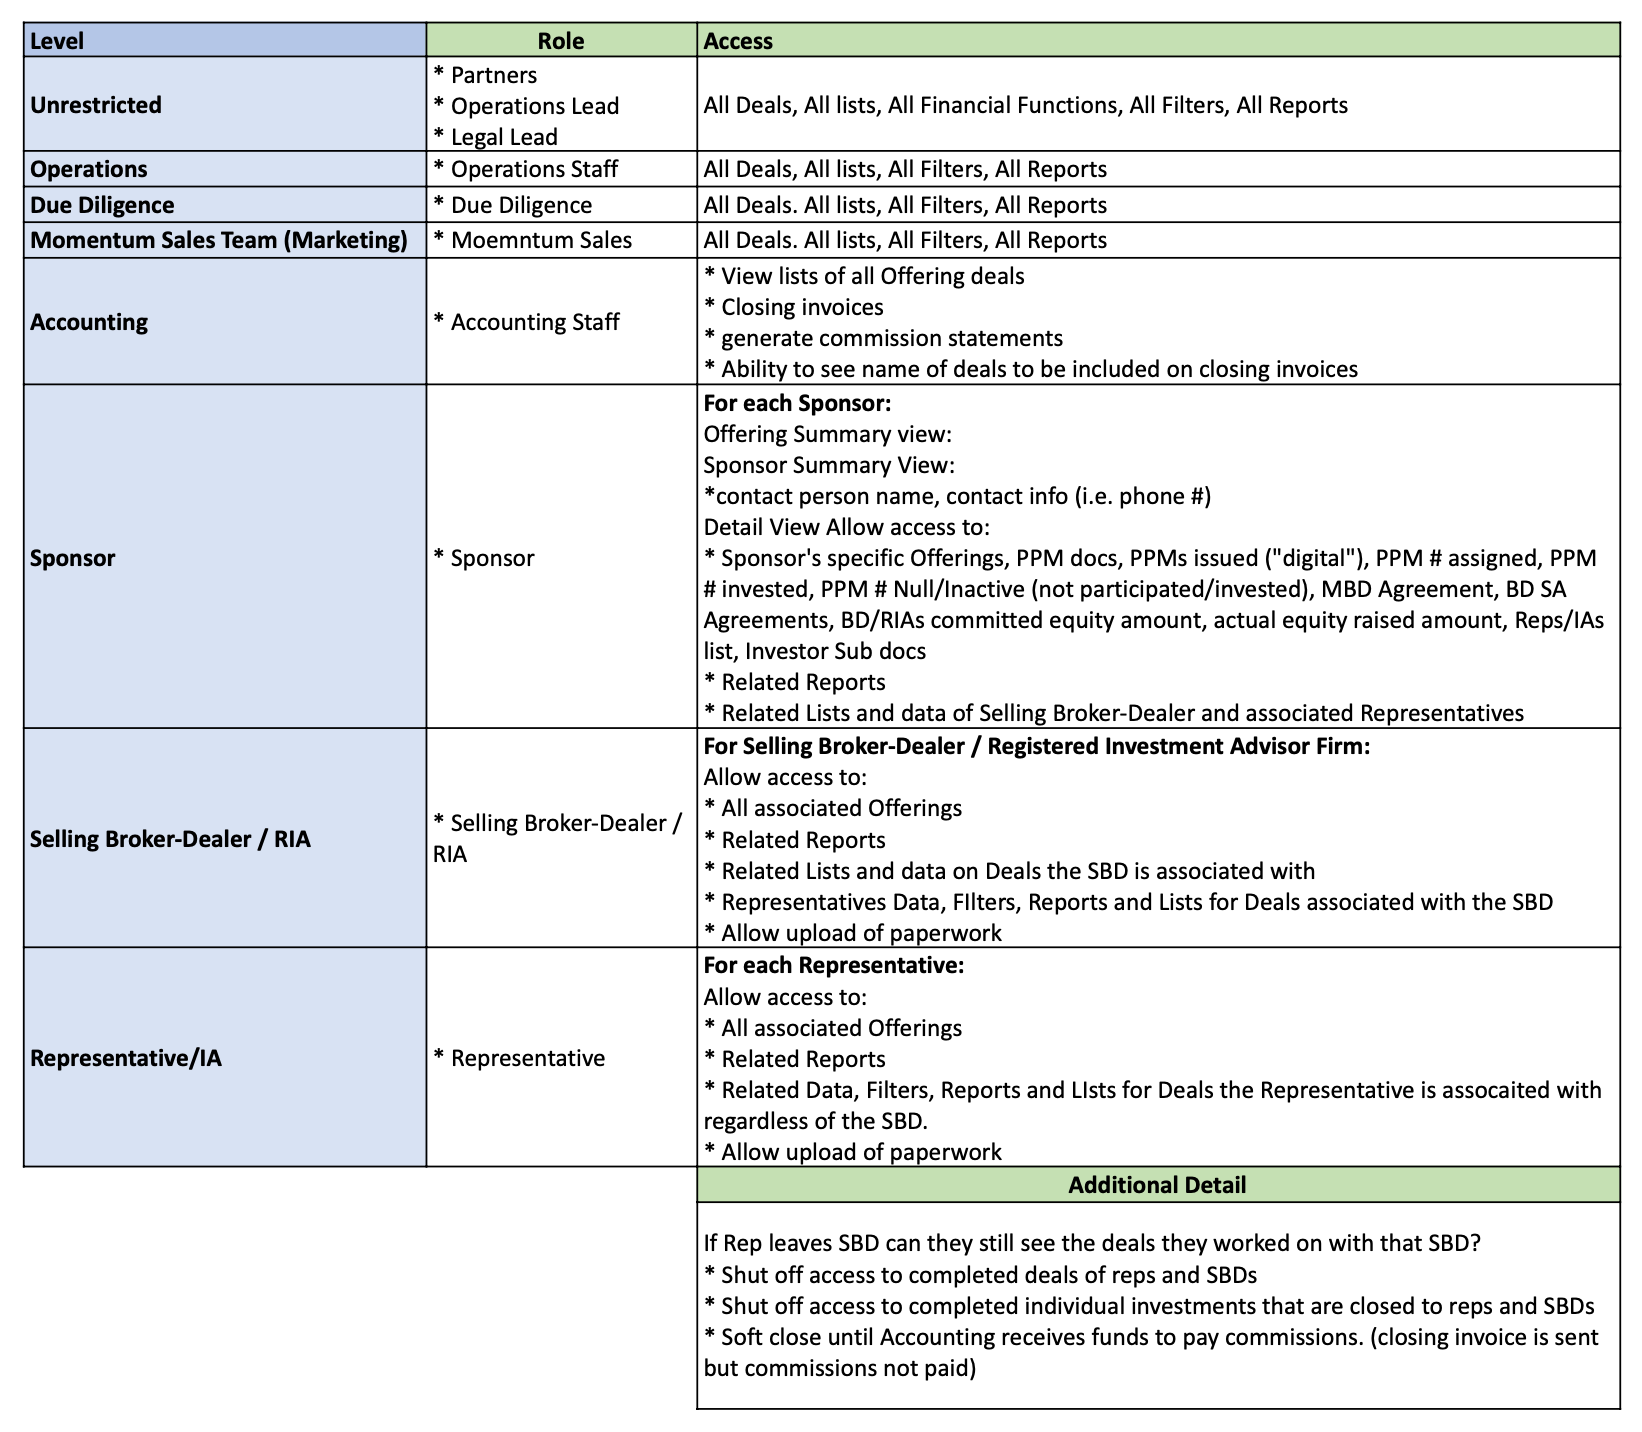
This User Permissions diagram outlined the Level, Role, and Access required for each user group. This was also key to the dev team in defining front and back login parameters:
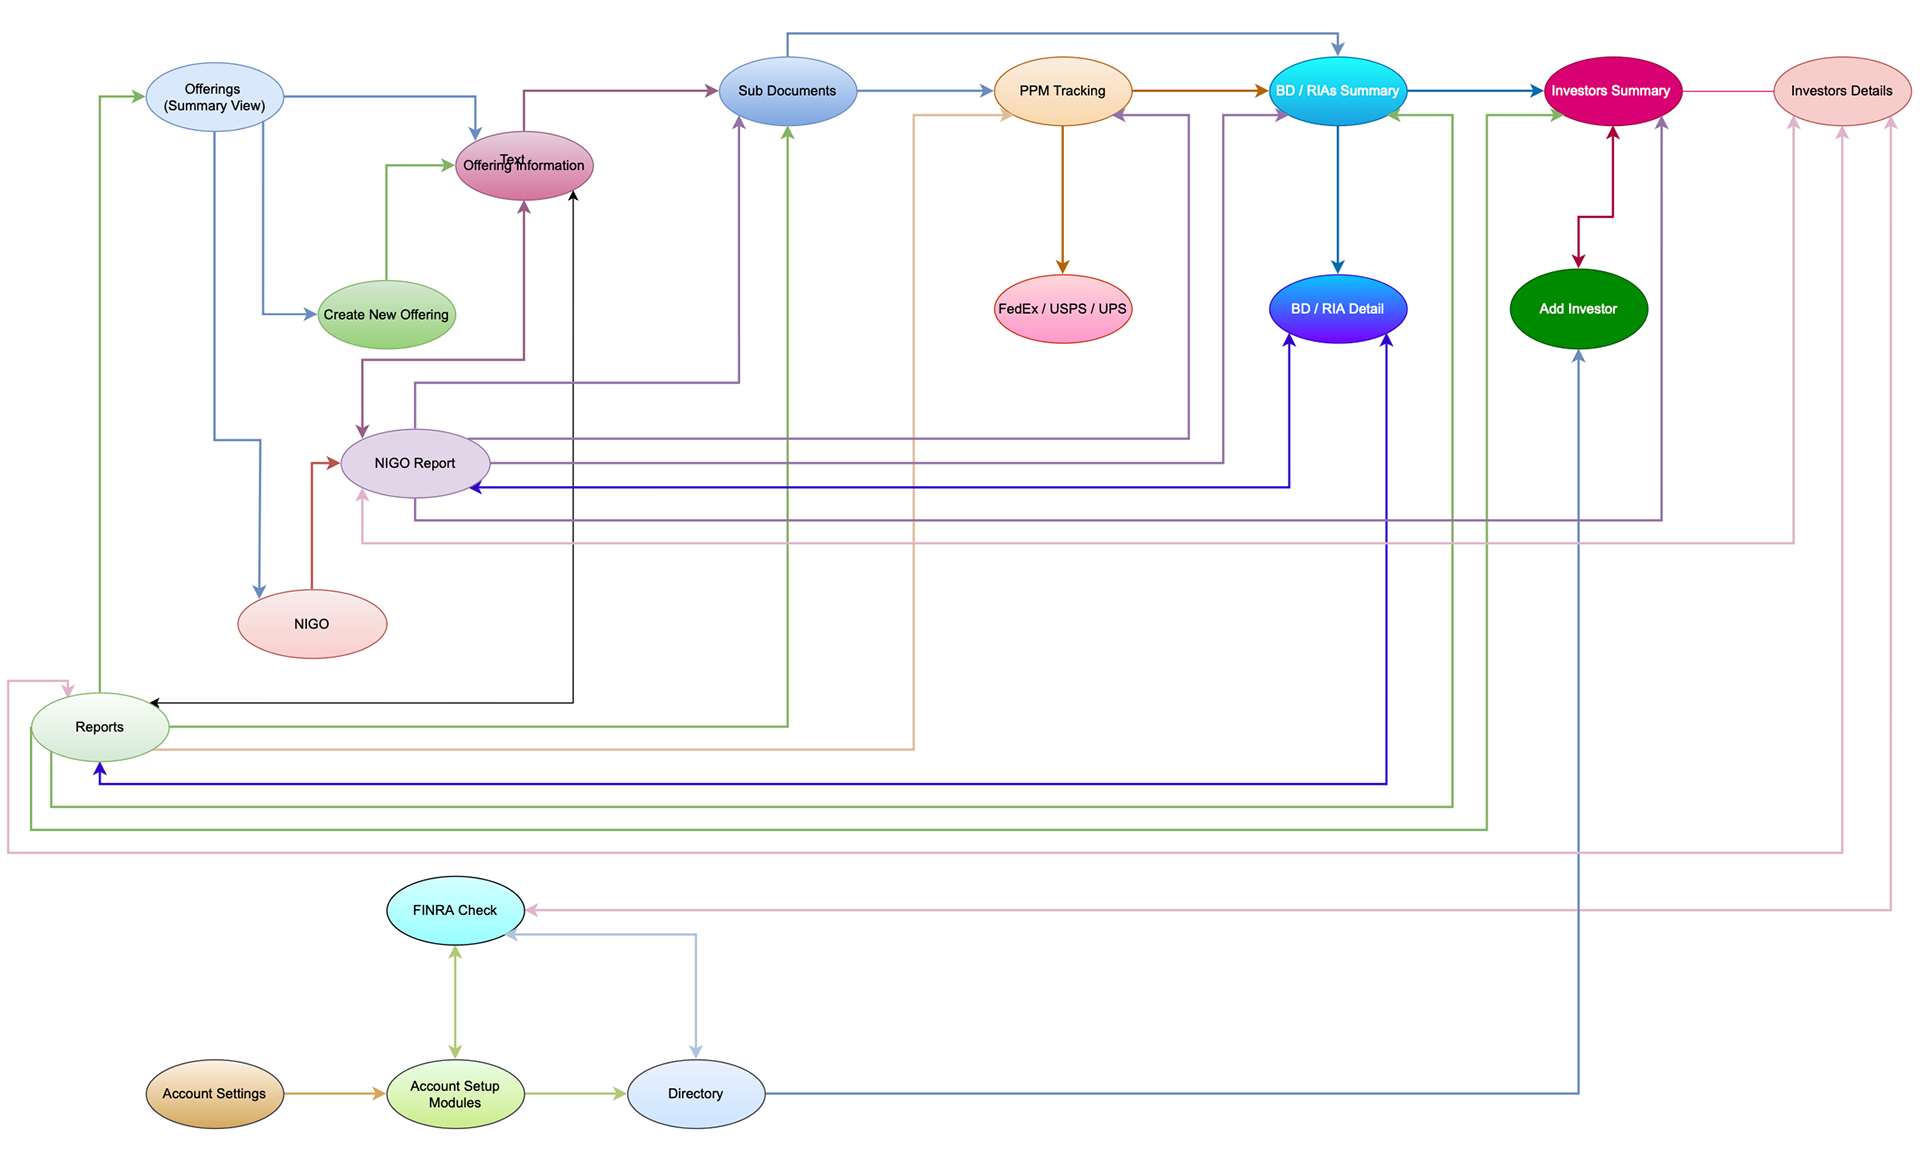
Below is a critical Dependency Diagram which assisted the team in visually understanding how all the process flow aspects related to one another, which, in turn, informed my UI wireframing designs. Up to this point in Orchard's business history they had never undergone an analysis of this caliber. The benefit of this exercise helped everyone involved in the project see where opportunities, gaps, and friction areas existed in their current processes. This also empowered us to see areas where we could optimize the platform we were designing:
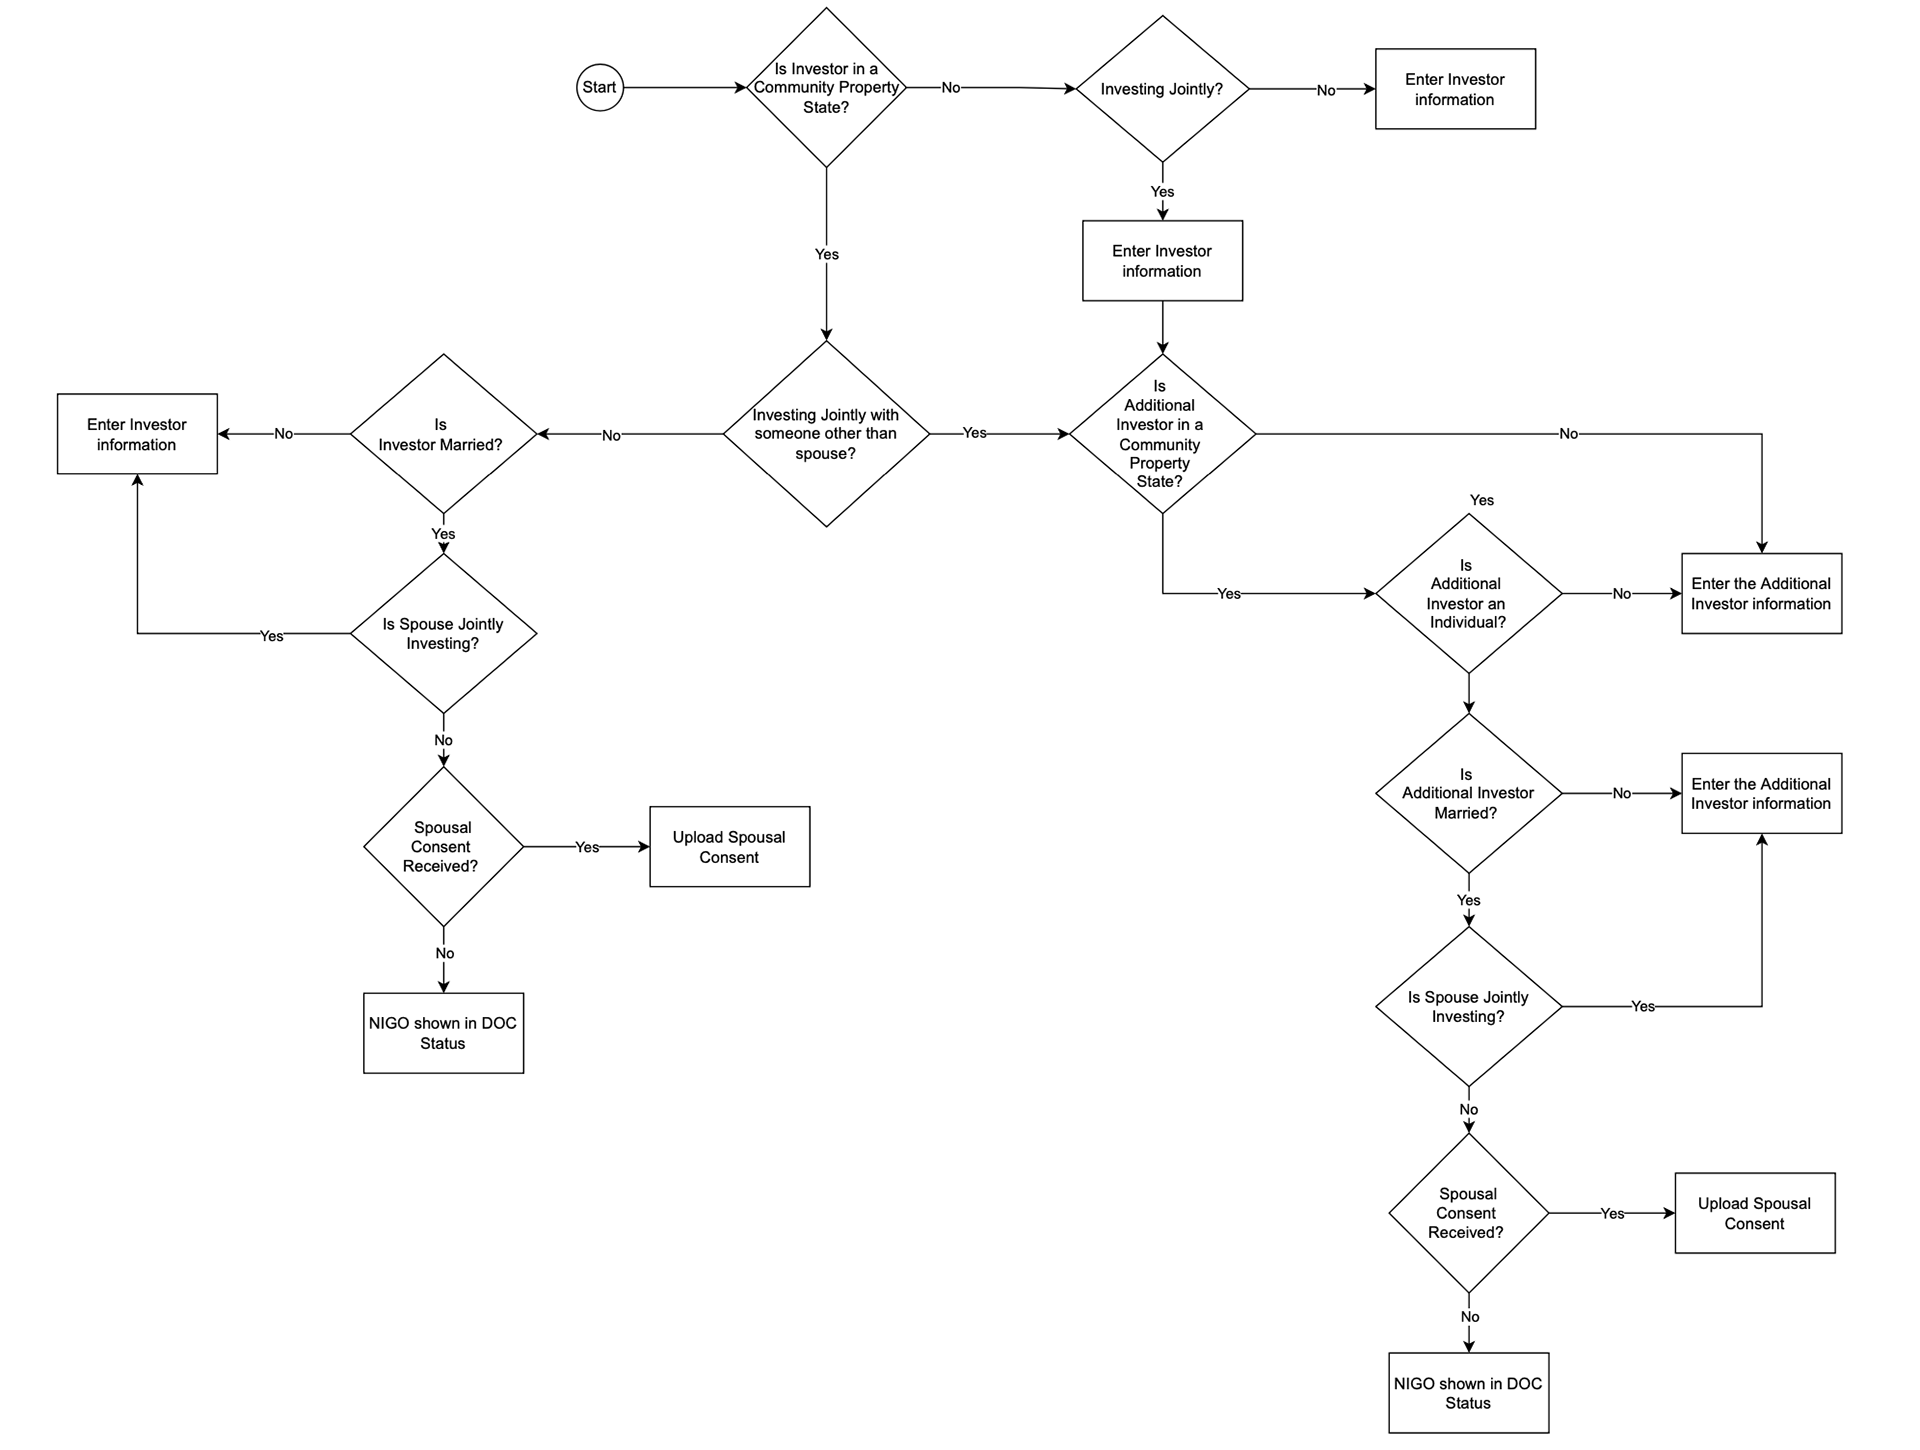
Another essential section of Orchard's Offerings involved the potential in certain states where Spousal Consent was required. We had to wrap our heads around things like Community Property States, marital status, and whether investors were investing jointly or not. This also influenced the UI elements to capture the correct / legal status of specific investors within specific Offerings over a period of time:
Ux/ui wireframing
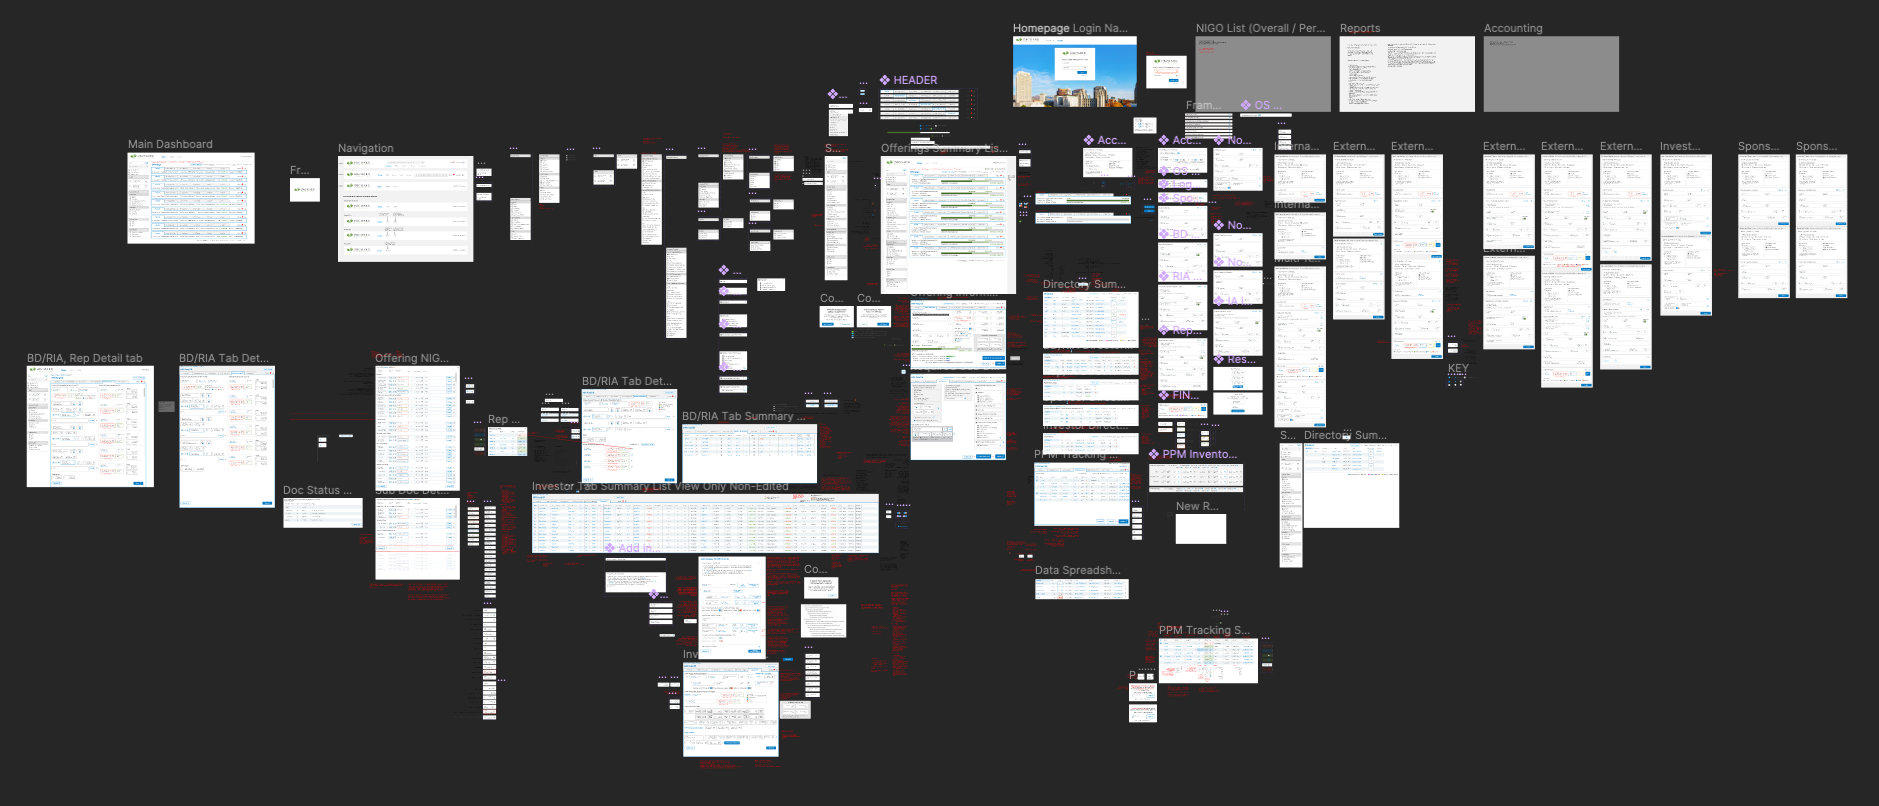
After sufficient discovery, user contextual interviews, diagrams, and analysis - we had a more clear direction on design requirements. Below is a high level view of wireframe pages that encompassed the entire work flow. This included:
• Dynamic User Login views based on permissions
• Dynamic Side bar Search AI, Filter & Category navigation / sub-navigation
• Offering Summary List page showing data visualization of total equity raise progress status
• Offering information capture for Sponsors, Sub Docs, PPM Tracking & Inventory checklist, Broker Dealer / Rep / Investor tracking, and Not In Good Order "NIGO" event tracking (this was any document uploaded into the system that was not completed or executed correctly)
• Comprehensive Directory of user groups - some users had more than one role which meant certain permission allowances as well as regulatory requirements had to be carefully captured
• Document Status History - tracked every document associated with an Offering, when it was updated, what status change was made, when, and by whom
• Hierarchy tracking of Broker Dealer-to-Representative FINRA checks and reporting status
final thoughts
When billions of dollars are being accounted for across hundreds of Offerings a year - this project was incredible to work on just in terms of how high the stakes were and how complex the solution had to be. It was a pleasure to work on and very validating to see user satisfaction rates increase 87% from their prior manual process, as well as reduced NIGO events by 98%.